
Numbers leadership can act on without checking them twice.
When leadership cannot trust the numbers, even a polished dashboard is noise. Figures arrive late, disagree or depend on one person to assemble them. Suntek has been building operational reporting since 2006. We reconcile the sources and definitions first, then deliver a current, consistent view where decisions are made: dashboard, inbox, phone, alert or downstream workflow.
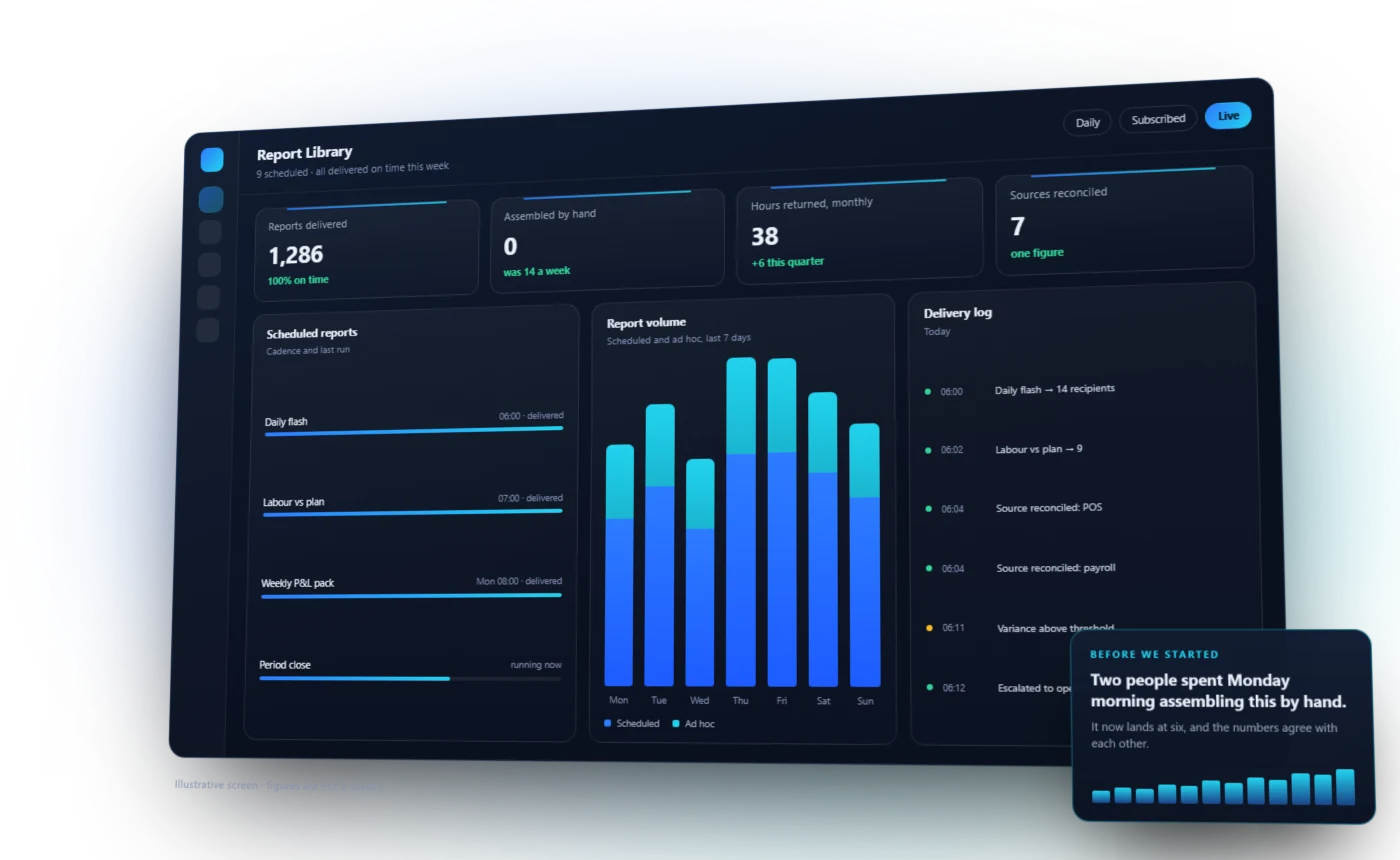
- The problem
- Leadership cannot trust the numbers. The answer arrives late, changes by source or needs a private spreadsheet before anyone will use it.
- What changes
- The business gets one current operating picture with agreed definitions, clear ownership and a path back to the source behind every measure.
- How Suntek works
- We fix the data foundation before polishing the view, then deliver the result in the place where the next decision or action happens.
Trusted by names you know











Clients and systems include Five Guys, Yoshinoya, Café Zupas, Casa Do Brasil, Arby's, Carvertise, Tosoh Quartz, Delivered Dish, Units Storage, PAR Technology, Brink POS.
You probably recognise
- A report that takes hours to prepare and is out of date on arrival.
- Two dashboards showing different answers to the same question.
- Decisions delayed while somebody verifies the numbers.
- Reporting that only one person actually knows how to produce.
Reporting you can build, read, share and forget about.
The platform underneath is the one we have been building since 2006. These are the parts of it people actually use.
Build it
- Any data source
- Databases, APIs, point of sale, spreadsheets and legacy systems, connected once.
- Query quickly
- Built-in intelligence, or paste the SQL you already have.
- Data views
- Save a filtered slice once and it becomes the building block everything else reuses.
- Build on the fly
- A new report is minutes of work, not a ticket that waits on us.
Read it
- Unlimited dashboards
- Create, provision and share without a seat count deciding who gets to see.
- Pivot tables and charts
- Maps, pie, line, bar, and tabular data beside the visual rather than on another screen.
- Auto-refresh and full screen
- Built for the monitor on the wall as well as the laptop.
- iOS and Android
- The same dashboards on a phone, for the people who are not at a desk.
Share it
- Role-based permissions
- Control at user and department level, so the numbers reach the right people and stop there.
- Share within the organization
- Send a view, not a screenshot. It stays live after it lands.
- Clone and customize
- Take a shared report, apply your own filters, leave the original alone.
- Task management
- Assign the action the number implies, from the report that surfaced it.
Automate it
- Scheduled email
- PDF, CSV or Excel, with the charts, on the morning it is needed.
- Threshold alerts
- A text or a push notification when a number crosses the line you set.
- FTP delivery
- For the systems and the accountants that still want a file in a folder.
- Dashboard filters
- One filter across many reports at once, so a question gets asked in one place.
A useful report closes the gap between seeing and doing.
The output may be a dashboard, a file, an alert or a task. The right form is the one that reaches the person who can change the result.
A daily operating picture
Bring sales, labor, inventory and exceptions together across locations before the next day's decisions are already underway.
Payroll and tip reconciliation
Turn source transactions and approved rules into a repeatable review and export instead of a pay-period spreadsheet build.
Continuity through a migration
Rebuild the reports the business genuinely runs on so a platform change does not remove the operating visibility it needs.
Action from a threshold
Notify the right person and create the follow-up when a measure crosses its boundary, rather than waiting for somebody to notice a dashboard.
The systems you already run.
Categories rather than logos: the list of named platforms changes, and the point does not. If something here is missing, it is a connector, not a rebuild.
- Point of sale
- Payroll providers
- Accounting software
- Delivery platforms
- Inventory systems
- Rewards and loyalty
- Legacy databases
- Custom forms
- Tip pooling
- Scheduling
- Any documented API
How the work runs
Agree what matters
A short list of measures the business will genuinely act on beats a dashboard nobody opens twice.
Fix the source
Most reporting problems are data problems. We deal with the underlying inconsistency rather than formatting around it.
Deliver it where it is used
On a screen, in an inbox, or on a phone. The right place is wherever the decision actually gets made.
Which number do you not quite trust?
Tell us which report causes the most doubt and we will look at why.